A New Kind Of Stock Market Research Tool.

Stocktagon is a unique way of finding companies talking about a topic. See the entire market at once, rather than one filing at a time.

Learn More

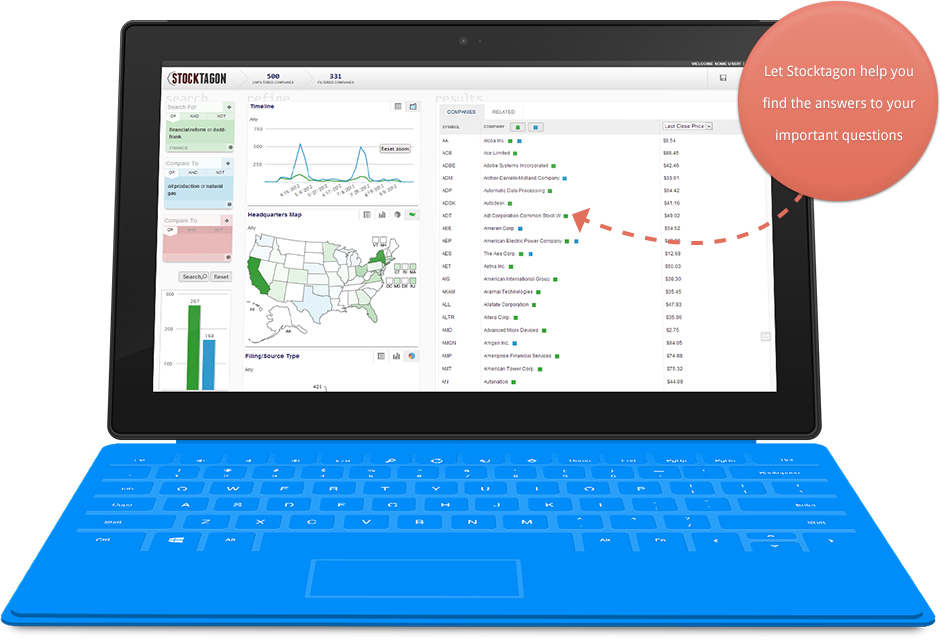
Search. Find Trends. See Everything.

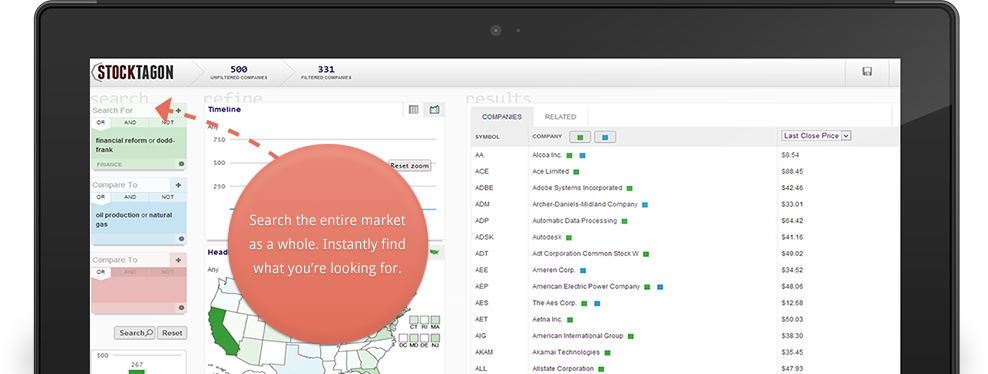
Stocktagon is a new kind of equity market research tool. Gone are the days of poring over pages of results. See the entire market that matches your search at once.

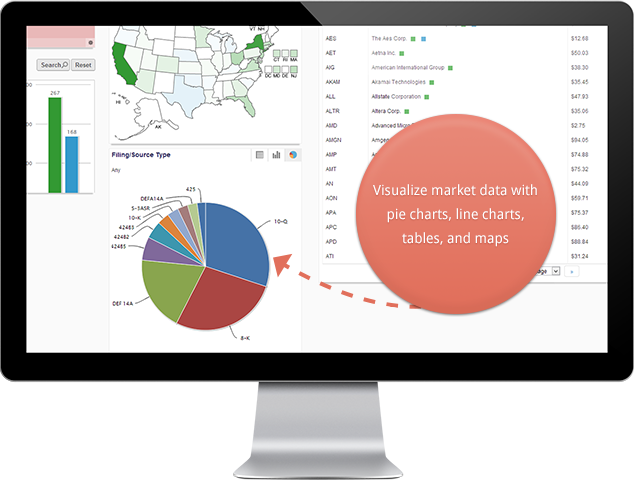
Visualize dimensions of companies, and naturally interact with the visualizations to drill down. Compare multiple searches together to discover trends.

This isn't just a financial document search engine. It's a personal market researcher at your fingertips.

It's not a trading platform.
It's an intelligence platform.

Discover which Ohio companies in the S&P 500 are talking about natural gas in their annual report. Compare "big data" to "business intelligence", drill-down, and discover your own trends before anyone else. Search for "financial reform" and find that Acme Financial is a bigger player than you might realize. And all of this in seconds from your computer or tablet.

You won't be managing your portfolio or performing trades with Stocktagon. In fact, we don't use your private data at all. We combine years of textual data and complex algorithms to bring you an intelligence platform of a new kind.

Search the Market

Don't just search documents. Search the market.

You're familiar with the other financial document research tools out there. Encounter a big screen of gray boxes, enter some foreign syntax, scroll through some drop-downs to filter your results before you even see them, and click a gray Search button to find... a page of 25 results. Followed by another page of 25 results. We thought there had to be a better option, so we created one.

When you search with Stocktagon, you see the entire market as a whole. Sure, we'll show you the documents that match and highlight the matching terms, but the real power is in interacting with the whole result set to narrow down exactly what you're looking for. And unlike other tools, we allow you to do this naturally, after (not before) you've seen the results of your search.

Visualize to discover. Slice and dice to expose.

A pie chart showing the stock exchanges of the companies that match your search term. A bar chart showing the top 5 SIC codes. A heat map of the United States with their headquarters by state. A timeline chart showing number of document matches over time, combined stock price, average stock price, or volume. And you can always see a detailed table view of every dimension, as well as your classic list of results.

That's just the tip of the iceberg. Compare up to 5 searches together and see the results color-coded to your terms. Tap or click on a pie slice, table row, or geographic state to apply a filter to all the results at once. Drage the timeline to show results only between two dates. See detailed information of the resulting companies and their matching documents. And export to Excel to load into the financial tool of your choice.

Big Data. Bigger Results.

First we take years of SEC filings and other data rich with searchable terms and put it all in one place so it's searchable together, rather than in separate tools. Then we combine that data with advanced search indexing, natural language processing, company details, stock price data, and dozens of advanced algorithms to bring you a smart, advanced research tool that crunches through the entire market, usually in less than a second. We also automatically find recurring mentions of people, organizations, and locations to help you discover a connection you might be missing.

You could pay an intern to do this in a few weeks, or let Stocktagon's big data work for you in a few seconds.

Terms and Conditions.

Features and their availability are not guaranteed and are subject to change. Use of the platform is subject to the privacy policy and terms of use.